Tuesday, April 7, 2009

Inventive Problem Solving


TRIZ – The Theory of Inventive Problem Solving :

INTRODUCTION

What is TRIZ?

The development of TRIZ began in 1946 by Genrich Altshuller and his colleagues in the former USSR. TRIZ, or theory of inventive problem solving, was developed on the premise that there are universal principles of invention. These premises are the basis for creative innovation that advance technology, and that if these principles could be identified and codified, they could be taught to people to make the process of invention more predictable.

Since Altshuller’s initial work in 1946, over two million patents have been examined and three common themes of innovation have been identified:

1. Solutions and problems are common across the many different industries and sciences.

2. Technical evolution has patterns that are common across the many different industries and sciences.

Innovations use scientific effects outside the field where they are developed

Aside from the three common themes found in innovation, TRIZ has also brought forth tools in the form of the Contradiction Matrix, the 40 Principles, the Trends of Evolution, the Standard Solutions, and the 2,500 Effects and Resources

Although there are different tools in TRIZ, all help in the process of problem solving used to solve product design, engineering design, and organizational problems

Why Use TRIZ?

Due to the fact competition within industries is fierce and customers demand better products for a smaller cost, there is a need for more innovative approaches. “Current research shows that TRIZ accelerates idea generation for products, services, and quality improvement by factors ranging from 70% - 300%” . “TRIZ also forces the product development professional to look outside the box, to look into the future, and to look at successful ways of solving a problem using technology that the practitioner does not even know about” .


METHODS

How to Use TRIZ

TRIZ is a way of using existing patterns of problem solving and invention to solve your problem. This can be done using databases or books, will not provide detailed design/problem solving steps, but only concepts. TRIZ can also be integrated with tools such as QFD and Six Sigma to increase their power. However, TRIZ is a complex application that is impossible to use effectively without a firm understanding of it.


Who Uses TRIZ?

TRIZ was once predominantly found in the USSR and Russia but has become prevalent throughout the U.S and Europe. Below are some significant U.S. companies who apply TRIZ:

Procter & Gamble Xerox Ford Kodak

Motorola 3M Siemens Philips

An Example of TRIZ I

A standard industry corrosion test is to take samples, for which the corrosion rate needs to be measured, and immerse them in the corrosive solution and weigh the samples before and after. These weight differences are then converted, through the knowledge of the geometry of the sample, into a miles/year corrosion rate.

Consider the case of a sample test that must be run for which there is a high corrosion rate, not only for the sample, but for the traditionally used container. The typical engineering approach would be to make the holding container out of an expensive, totally corrosion resistant material such as gold or platinum. If we consider some of the basic TRIZ concepts of ideality and resources, we would first ask an ideality question such as: “How can the container perform its function without existing”?

A visual picture of the sample with a blob of corrosive media around it would be visualized. We all know this isn’t practical, but it gets our brain started in a new, focused direction. Next, we ask, “How can I approach the ideal state with the resources I have in the system?” A review of this system would suggest we have the sample itself, its material properties, and its geometric properties, including surface/surface area, volume, etc.

We begin to recognize that the internal volume of the sample is an unused resource, and since it is not serving any other function, we can simply cut out a section of the sample and put the corrosive medium inside the sample. We then measure the corrosion in exactly the same way we did before. We have avoided the expense of new materials and made the measuring technique more robust. This example illustrates both the ideality and resource principles of the TRIZ problem-solving process.


An Example of TRIZ II


Other examples of using TRIZ do not need to be complicated. The philosophies and tools can be used in everyday life and basic products. For example, using the TRIZ separation upon condition principle, Crayola® products can be examined. “The new Crayola® product for kids coloring uses a special crayon and paper design to create a product which only allows writing on the special paper one must buy from Crayola®. The crayons will not write on walls”


Work Breakdown Structure

Introduction :

A work breakdown structure is a results-oriented planning tool that simply organizes all the work of a project. Work breakdown structures are usually portrayed graphically in a hierarchical tree; however, it can also be displayed in outline form with lists of categories and tasks.
Work breakdown structures enable the user to physically diagram and group elements of a project that encompass the entire scope of the project. The structure allows the user to break down a large project into descending, detailed levels. Each detailed level outlines the project’s work, but not the work itself.

How to use Work Breakdown Structures

In planning large projects, it is common for a person to get overwhelmed and frustrated with all of the tasks which are involved in the process. Even on smaller projects, it is difficult to comprehend every detail which will take place over a certain period of time and by a number of different people. Work breakdown structures can help simplify projects in these situations. Work breakdown structures follow these five simple steps:

1. To begin a work breakdown structure, start with the broadest area of detail to create a clear goal of what needs to be accomplished. Beginning with correct goals helps keep the work on the schedule and maintains a clear focus on what needs to be accomplished.

2. Assemble a team which will help you manage differing areas of the project. Psychologists say that our brains can normally comprehend 7-9 items at one time; therefore, assembling a team to help manage a large project is critical. In choosing a team, gather ‘decision makers’ and ‘action planners’ who posses the knowledge to know what needs to be accomplished and understand in which order tasks need to be completed.

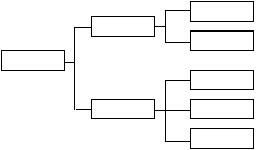
3. Break down the project into organized divisions by generating major work breakdown structure headings. These headings represent the broadest areas to accomplish. Begin by brainstorming ideas and major headings for the various paths involved in the work breakdown structure. It is a good idea to write these headings on cards so that they can be seen and the broadest level of detail emerges. The cards give you flexibility to move ideas around. The cards also help open up the secondary level of the breakdown structure and keep it from being to narrow. Some cards will need to be adjusted and removed until the breakdown structure is completed and looks something like the following:


4. Complete the work under each major heading or path (level 2). With the goal statement clearly in mind, ask yourself at each level, “what needs to happen, be addressed, or be resolved.” Index cards are also useful to fill in levels of detail as you continue down each pathway until all tasks are completed.

5. Review the work breakdown structure to ensure logical order and completion. At each level, check the logical order and flow. Begin with the most specific details and move to the general by asking the question, “Will these actions lead to these results?” Then reverse the direction by beginning with the general details and moving to the most specific. In this step, ask the question, “Do I really need to do this task in order to accomplish these results?”


Example of a Work Breakdown Structure


You have been selected by the president of the company to coordinate the company’s Christmas Banquet this year. In order to create an effective WBS, follow the steps mentioned above.


1. Plan an effective banquet in which all employees of company can enjoy a nice dinner, gain company motivation, and associate with fellow co-workers.

2. Choose effective team members which have knowledge about differing areas of planning a banquet dinner, planning parties, or other company functions.

3. Create and organize major headings, which are pathways to follow in accomplishing the overall project. Write the headings on cards as follows:


Create an Effective Banquet


4. Complete the tasks under each major heading. Ask yourself these questions at each level, “What needs to happen, be addressed, or be resolved?” Create additional index cards to fill in the levels of detail as you continue down each pathway until the tasks are all completed. Complete the cards as shown:

NOTE: On each card, it is helpful to write out specific details

Create an Effective Banquet


5. Review the WBS to ensure logical order and flow. Begin with the specific detail and move toward the more general detail. At each card ask, “Will this action lead to a successful company banquet?” Then, begin with the more general details and work toward the more specific, asking, “In order to accomplish a successful company banquet, do I really need to do this task?”


Following these steps in the work breakdown structure will greatly help in this situation of planning a large company banquet. Using work breakdown structures help simplify the project and distribute the work load more evenly, creating an effective plan to accomplish sizable projects.


Work Breakdown Structure

Introduction

A work breakdown structure is a results-oriented planning tool that simply organizes all the work of a project. Work breakdown structures are usually portrayed graphically in a hierarchical tree; however, it can also be displayed in outline form with lists of categories and tasks.
Work breakdown structures enable the user to physically diagram and group elements of a project that encompass the entire scope of the project. The structure allows the user to break down a large project into descending, detailed levels. Each detailed level outlines the project’s work, but not the work itself.

How to use Work Breakdown Structures

In planning large projects, it is common for a person to get overwhelmed and frustrated with all of the tasks which are involved in the process. Even on smaller projects, it is difficult to comprehend every detail which will take place over a certain period of time and by a number of different people. Work breakdown structures can help simplify projects in these situations.

Work breakdown structures follow these five simple steps:

1. To begin a work breakdown structure, start with the broadest area of detail to create a clear goal of what needs to be accomplished. Beginning with correct goals helps keep the work on the schedule and maintains a clear focus on what needs to be accomplished.
2. Assemble a team which will help you manage differing areas of the project. Psychologists say that our brains can normally comprehend 7-9 items at one time; therefore, assembling a team to help manage a large project is critical. In choosing a team, gather ‘decision makers’ and ‘action planners’ who posses the knowledge to know what needs to be accomplished and understand in which order tasks need to be completed.
3. Break down the project into organized divisions by generating major work breakdown structure headings. These headings represent the broadest areas to accomplish. Begin by brainstorming ideas and major headings for the various paths involved in the work breakdown structure. It is a good idea to write these headings on cards so that they can be seen and the broadest level of detail emerges. The cards give you flexibility to move ideas around. The cards also help open up the secondary level of the breakdown structure and keep it from being to narrow. Some cards will need to be adjusted and removed until the breakdown structure is completed and looks something like the following:

Force Field Analysis

Introduction :


Force field analysis is a valuable change-management tool. This management technique was developed by Kurt Lewin, an expert in experiential learning, group dynamics and action research. Although Kurt Lewin contributed greatly to the field of social science, he is best-known for his development of the Force field analysis model in 1947.


Lewin’s force field analysis is evaluates the net impact of all forces that influence change. These forces can be divided into two groups: driving forces and restraining forces. Driving forces are all forces that push for and promote change. These change drivers promote and encourage the change process. Some examples of driving forces are executive mandate, customer demands, and increased efficiency. Restraining forces are forces that make change more difficult. These forces counteract driving forces and lead to the avoidance or resistance of change. Some examples of restraining forces are fear, lack of training, and the lack of incentives. When these two sets of forces are equal change is in a static state of equilibrium meaning that no movement towards or away from change is happening.


To better understand the connection between driving and restraining forces and how they impact change; a simple metaphor is of use (see illustration below). Suppose a group of helium-filled balloons are attached to a set of weights. The helium in the balloons creates an upward lift of five pounds. The weight of the attached weights is also five pounds. Because both the driving forces (balloons) and the restraining forces (weights) are equal, the balloons are unable to lift off the ground towards change. However, the addition of a single balloon or the removal of a single once of weight would change the balance and would start the system rising towards the envisioned change.


Implementation :


This section discusses how to implement the force field analysis into a business setting. Although there are several different methods and variations for conducting force field analysis, there are commonalities among all of them. The steps outlined below capture many of these commonalities and represent the process needed for successful implementation of a typical force field analysis.


  1. Identify and understand the current state
  2. Identify and understand the desired goal state relative to the proposed change.
  3. Identify and list driving forces acting to support the change. It is important to list all forces regardless of their seemingly small influence. Driving forces are forces acting to move the current state towards the goal state.
  4. Identify and list restraining forces acting to hinder the change. Remember restraining forces are forces holding the current state back from the goal state.
  5. For each force, designate the level of influence using a numerical scale e.g. 1=extremely weak and 7=extremely strong.
  6. Chart the forces by listing the driving forces on the left and restraining forces on the right. Also chart the numbers allocated in step 5 next to their related force.
  7. Evaluate the chart and determine whether change is viable.
  8. Discuss how the change can be affected by decreasing the strength of the restraining forces or by increasing the strength of driving forces.
  9. Discuss action strategies to eliminate the restraining forces and to capitalize on the driving forces.

Through conducting this process, a force field diagram like the one shown in figure 1.2 should be created.


As shown in the above force field diagram, the total point value for restraining forces exceeds the total value of the driving forces. This means that the proposed change would likely fail if nothing is done to change the balance. To increase the likelihood of success, management can attempt to reduce restraining forces, increase driving forces, or some combination of the two. In changing the impact of one force, the impacts of other forces often change as well. One example of this interdependency would occur if management decides to reduce the level of employee fear be providing extra training and resources. The impact of fear as a restraining force may drop from a 7 to a 4, but the capital investment restraining force may increase from a 3 to a 7 resulting in a higher restraining force than before the change. The relationships among the many forces must be understood and evaluated before strategies to eliminate the restraining forces and to capitalize on the driving forces are implemented.

Applications


Force field analysis is being used for many different applications in a wide variety of industries.


There are three main applications of the force field analysis tool:


  1. Change management (which has been the focus of this article)
  2. productivity improvement
  3. decision making

Change management is the primary application for force field analysis. One industry that has embraced the usefulness of this tool is the health care industry. Change is a regular occurrence in the healthcare environment. One area of change in which the health care industry has used force field analysis is in the computerization of nursing systems. Nurses have widely varying attitudes toward computers and change in the workplace. To help in the transition, managers are evaluating the forces that encourage and the forces that impede the change. Based on the force field analysis, strategies must be developed to assist nurses in moving forward with the transition.

Productivity improvement is the second main application of force field analysis. This universal application of how to increase employee productivity demonstrates a powerful need for the force field analysis tool. Instead of looking at factors promoting and inhibiting change, managers can look at forces promoting and inhibiting productivity. This analysis can shed light on methods, strategies, and systems that can promote long-term improvements in employee productivity.

Force field analysis is also a powerful decision-making tool. By evaluating the forces supporting and opposing a specific decision, managers can know the likelihood of acceptance and can also manage the influencing forces to maximize the potential for acceptance and success.

The force field model is a valuable tool for use in these three applications; however, it is not limited to these forms of application. By understanding the principles of force field analysis, managers can customize the technique for use in a large variety of situations.

By recognizing that every decision and every change has forces that promote the change and forces that impede the change, managers can make smarter decisions and can use force field analysis to effectively manage change in their organizations.


Sources for more Information


Although there are no books dedicated to force field analysis, there are many sources available to further learn about methods and applications of this diverse and effective tool. Here are a few that I have used in my research of force field analysis.


The New Seven Tools of Quality


The New Seven Tools of Quality :


Affinity Diagram :


This Affinity Diagram is a very useful tool to use when brainstorming is the main goal. This is an especially effective tool because it allows the participants to be both creative and logical. By generating ideas the participants are tapping into their creative side, and organizing those ideas allows them to exercise logic. There are 3 main instances when an affinity diagram is especially useful. First, when the problem is complex or hard to understand. Second, when the problem is very large and could appear to be overwhelming. Last, when support and involvement of another group is required. There are six basic steps to creating an affinity diagram:


1. Identify the problem or issue

2. Each person writes issues related to problem on note card or sticky notes

3. Organize the cards or sticky notes into logical piles

4. Name each pile with a header

5. Draw an affinity diagram

6. Discuss the piles created


Below is an example of an affinity diagram:


The Interrelationship Digraph:


The main purpose of the interrelationship digraph is to depict the relationships between different issues. Often times this digraph is used in conjunction with the affinity diagram. It can be very powerful in that it reveals the impact one issue can have on other issues.


There are seven steps to create an interrelationship diagram:


1. Identify problem or issue

2. Write each element that relates to problem in a box

3. Draw arrows from the element that influences to the element that is influenced

4. Draw the strongest influence if two elements impact each other

5. Count the arrows

6. Elements with the most outgoing arrows will be root causes or drivers

7. The elements with the most incoming arrows will be key outcomes or results


Below is an example of an interrelationship digraph:


Tree Diagram :


A tree diagram is often used to discover the steps needed to solve a given problem. It always the user(s) to gain further insight into the problem and helps the team focus on specific tasks to complement the tasks at hand to solve the problem.

There are five major steps in creating a tree diagram. They are:

1. Determine the main goal

2. Be concise

3. Brainstorm the main tasks involved in solving the problem and add them to the tree

4. Brainstorm subtask that can also be added to the tree

5. Do this until all possibilities have been exhausted


Below is an example of a tree diagram:


Prioritization Grid :

A prioritization grid is typically used to make decisions that require analysis of several criteria. These situations could have several options that need to be compared and several criteria that need to be considered.

There are eight steps to develop a prioritization grid.They are:

1. Identify your goal

2. Rank the criteria in order from least important to most important

3. Assign each criterion a weight for each option, and be sure the sum of all weights equals one

4. Sum the individual rating for each criterion to come to an overall ranking. Divide by the number of options to find an average ranking.

5. Rank order each option with respect to the criteria. Average the rankings and apply a completed ranking

6. Multiply the criteria weight by its associated criterion rank for each criterion in the matrix. The result in each cell of the matrix is called an importance score

7. Sum the importance scores for each alternative

8. Rank the alternatives in order of importance


Below is an example of a prioritization grid:


Matrix Diagram :

The matrix diagram is a good tool to use to compare the efficiency and effectiveness of alternatives based on the relationship between two criteria. It uses criteria and symbols to visually depict the relationship between For example, a user could analyze the relationship between cost and performance. Matrix diagrams can be used with up to four dimensions. There are several styles of matrix diagrams. The most common styles are the L-shape, the T- shape, and the Y-shape.

There are five steps in constructing a matrix diagram.

1. Decide the factors that are the most important to make the decision

2. Select the style of matrix that will help the best

3. Select the symbols to be used to represent the relationships

4. Complete the matrix using the determined factors and symbols

5. Analyze the completed matrix


Below is an example of a matrix diagram:


Process Decision Program Chart :

The Process Decision Program Chart is a good tool to use for contingency planning. It helps to realize what could go wrong or problems associated with the implementation of programs and improvements.

There are four main steps to creating a Process Decision Program Chart. They are:

1. List the steps in the process you wish to analyze

2. List what could go wrong at each step

3. List the counter measures to the problems

4. Evaluate the counter measures by placing an O for feasible or an X for not feasible


Below is an example of a Process Decision Program Chart :


Activity Network Diagrams :


The Activity Network Diagram is also known as the PERT diagram or the critical path diagram. It evaluates the time it takes from the beginning of a process to the end of a process and determines where there is slack time, and what parts of the process can be improved in relation to time.

There are several steps in developing an Activity Network Diagram.They are:

1. List all tasks

2. Determine the time it takes for each task

3. For each task, determine the task that must happen before the current task can take place

4. Draw the network diagram

5. Compute early start and early finish times for each task

6. Compute the late start and late finish times for each task

7. Compute slack time

8. Determine the critical path


Below is an example of an Activity Network Diagram:


Designer: Douglas Bowman | Dimodifikasi oleh Abdul Munir Original Posting Rounders 3 Column